Home / Learn / Business Metrics & KPIs / Marketing Metrics and KPIs
Marketing Metrics and KPIs
Learn about marketing metrics and KPIs, who uses them, and why they are important in marketing. Also, discover popular tools for collecting and analyzing marketing data.

Understanding Marketing Metrics and KPIs
Marketing metrics and KPIs (key performance indicators) are measurements that help businesses evaluate the success of their marketing campaigns. These metrics can be used to track progress toward specific goals, identify areas of improvement, and make data-driven decisions.
What are Marketing Metrics and KPIs?
Marketing metrics are quantitative measurements that track the performance of marketing activities. Common examples include website traffic, conversion rates, and customer acquisition costs. KPIs are specific metrics that are chosen based on their relevance to a specific goal. For example, a KPI for a social media campaign might be the number of shares or likes that a post receives.
Why Do Marketing Metrics and KPIs Matter?
Marketing metrics and KPIs are important because they help businesses understand how their marketing efforts impact their bottom line. By tracking these metrics over time, businesses can identify trends and make informed decisions about where to allocate resources. Additionally, KPIs can help businesses stay focused on achieving their goals and measure progress toward them.
Who Should Leverage Marketing Metrics and KPIs in Achieving Business Success?
Any business that wants to evaluate the success of their marketing campaigns can use marketing metrics and KPIs. This includes small businesses, startups, and large corporations. By tracking marketing metrics and KPIs, businesses can make data-driven decisions and improve the effectiveness of their marketing activities.
Best Tools for Collecting Your Marketing Metrics and KPIs
Google Analytics
Google Analytics is a free tool that provides detailed website metrics and KPIs. It allows businesses to track website traffic, user behavior, and conversion rates. With Google Analytics, businesses can get a comprehensive view of their website performance and make informed decisions about improving their website.
HubSpot
HubSpot is an all-in-one marketing platform that includes website analytics. It offers a range of website metrics and KPIs, including page views, bounce rates, and conversion rates. With HubSpot, businesses can track how users interact with their websites, create personalized user experiences, and improve website performance.
Salesforce
Salesforce is a customer relationship management (CRM) platform with website analytics. It offers a range of website metrics and KPIs, including website traffic, conversion rates, and customer acquisition costs. With Salesforce, businesses can get a comprehensive view of their website performance, track customer behavior, and make data-driven decisions to improve website performance.
The Best Way to Analyze Your Marketing Metrics & KPIs
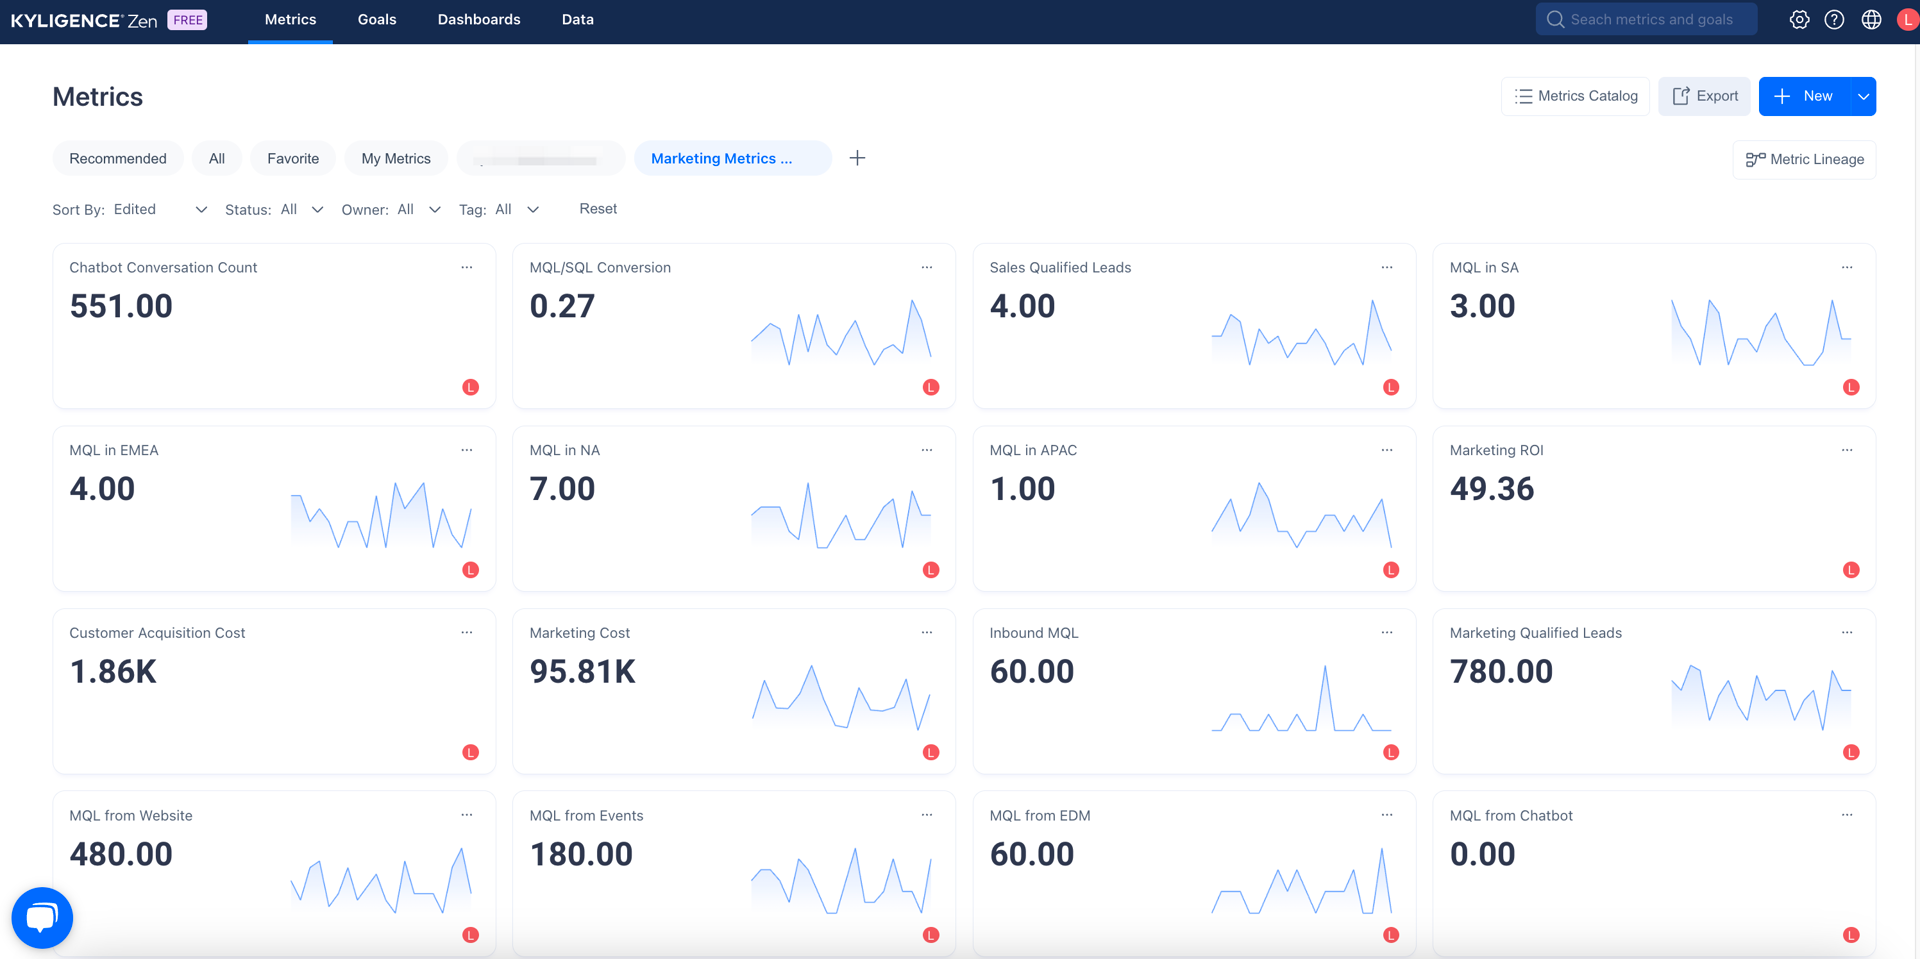
The best way to analyze your marketing metrics and KPIs is by leveraging Kyligence Zen as the central repository. Kyligence Zen is a metrics platform that helps your marketing team collect, organize, and analyze your marketing metrics and KPIs, allowing you to focus on taking action.
The metrics catalog is a centralized location where users can define, compute, organize, and share metrics. It helps your marketing team integrate your marketing analytics tools, including Google Analytics, HubSpot, and Salesforce. You can define metrics and KPIs in one place, then reuse them across different applications and business intelligence tools.
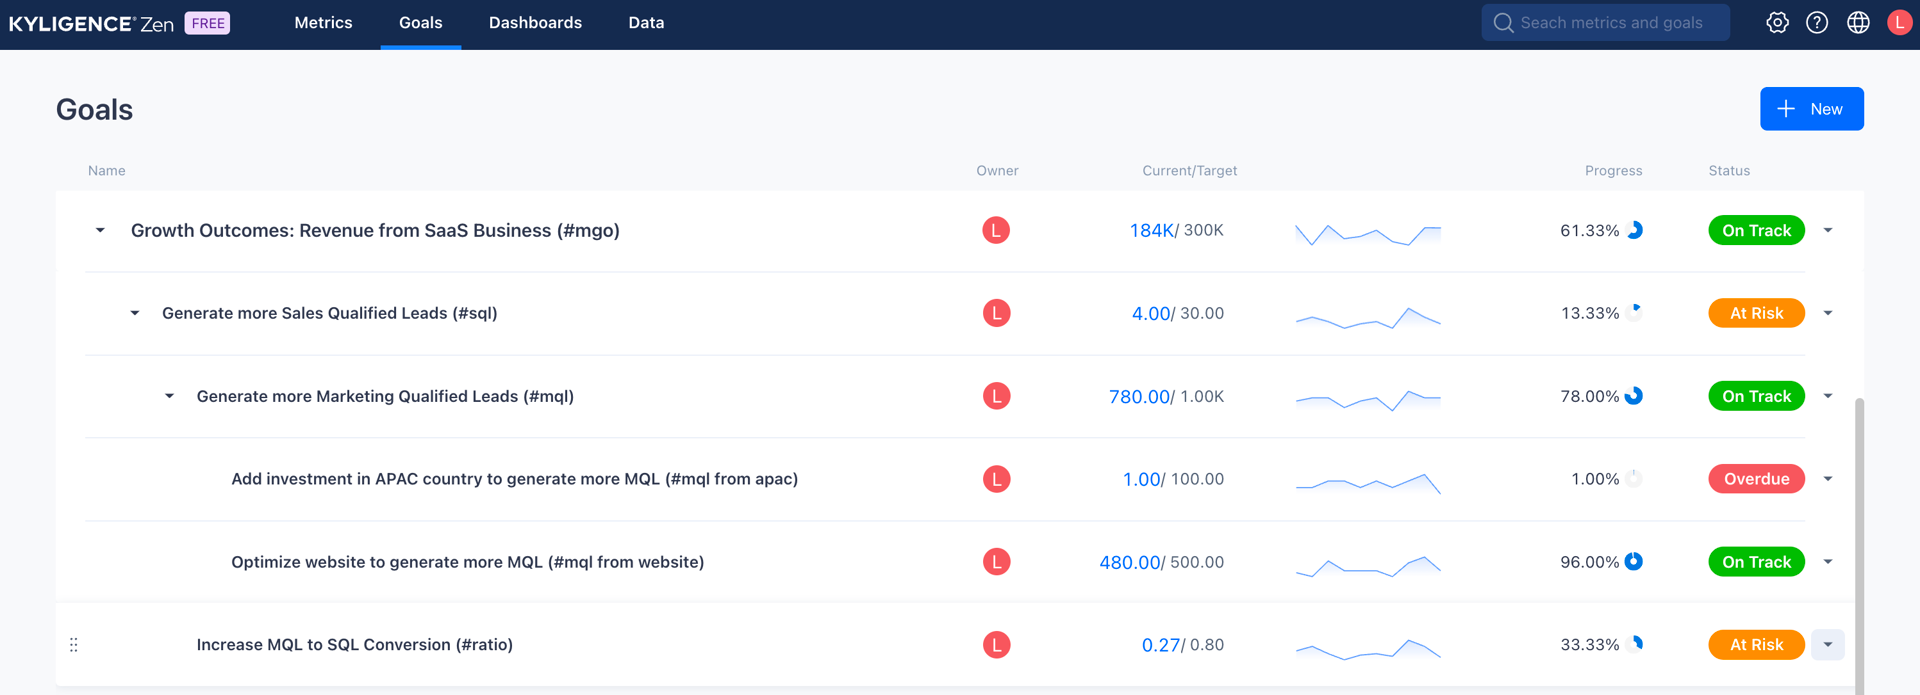
Kyligence Zen provides Goals to help the marketing team streamline the business decision-making process with unified metrics across all businesses, data consumers, and decision-makers. Goals enable organizations to break down business objectives into relevant metrics and targets, thus aiding in decision-making.
Marketing Metrics and KPIs Examples
Active Customers
Retail
The total number of unique customers who made at least one purchase during a specified time period.
Average Basket Size
Retail
The average number of products sold per transaction order during a specified time period.
Average Session Duration
Website
The average duration (in seconds) of users' sessions.
Average Time On Page
Website
The average time users spent viewing this page or a set of pages.
Average Transaction Revenue
Retail
The average profit earned per transaction order during a specified time period.
Average Transaction Value
Retail
The average sales amount per transaction order during a specified time period.
Bounce Rate
Website
The percentage of sessions that were not engaged ((Sessions Minus Engaged sessions) divided by Sessions). This metric is returned as a fraction; for example, 0.2761 means 27.61% of sessions were bounces.
Chatbot Conversation Count
Marketing
The number of conversation between the customers and the chatbot on the website
Cost Per Leads
Marketing
The average cost of each Marketing Qualified Leads
Marketing Metrics and KPIs Template

More Metrics and KPIs to Explore


Analyze Your Business Metrics & KPIs with Kyligence Zen Today
/
Ⓒ 2023 Kyligence, Inc. All rights reserved.