Home / Learn / Business Metrics & KPIs / Website Metrics and KPIs
Learn about website metrics and KPIs, who uses them, and why they are important in marketing. Also, discover popular tools for collecting and analyzing website data.
In the digital age, website metrics and key performance indicators (KPIs) provide valuable insights into the effectiveness of marketing efforts, user engagement, and overall business success.
Website metrics are data points that provide insights into website visitors' behavior. These metrics can include the number of visitors, page views, bounce rate, and conversion rate.
KPIs are specific website metrics that are tied to business goals. For example, if a business goal is to increase sales, a KPI might be the conversion rate of website visitors to paying customers.
By tracking website metrics and KPIs, businesses can gain insights into their marketing efforts' effectiveness and identify improvement areas. These insights can be used to optimize website design, content, and user experience, aiming to improve business performance.
For example, suppose a business notices a high bounce rate on a particular page of its website. In that case, it can investigate the cause and make changes to improve the user experience and encourage visitors to stay on the site longer. By doing so, they can increase conversions and ultimately drive more revenue.
Anyone responsible for driving business success should use website metrics and KPIs, including marketing teams, web developers, and business owners. By monitoring and analyzing website data, these stakeholders can make informed decisions about website design, content, and marketing strategies.
There are many tools available for collecting and analyzing website metrics and KPIs. Some popular options include:
These tools can help businesses track website metrics and KPIs, identify areas for improvement, and optimize website performance.
In conclusion, website metrics and KPIs are essential to any successful digital marketing strategy. By tracking and analyzing website data, businesses can gain insights into visitors' behavior and optimize their website design, content, and marketing strategies for maximum impact. With the right tools and strategies, businesses can drive website traffic, increase conversions, and ultimately achieve their business goals.
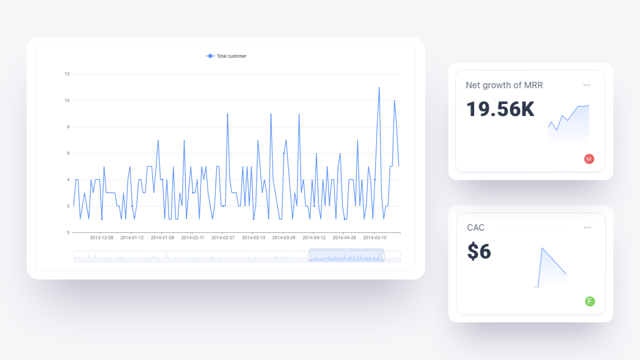
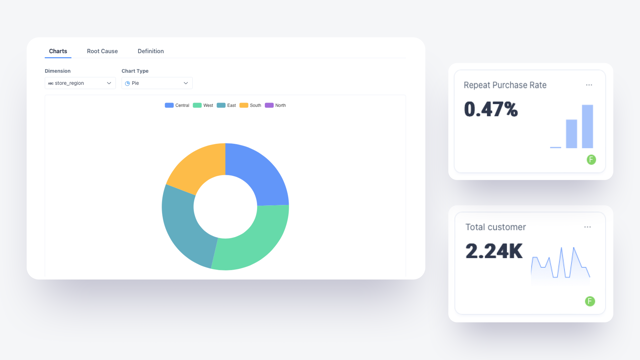
The best way to analyze your website metrics and KPIs is by leveraging Kyligence Zen as the central repository. Kyligence Zen is a metrics platform that helps your marketing team collect, organize, and analyze your website metrics and KPIs, allowing you to focus more on taking action.
Kyligence Zen offers dozens of Metrics Templates created by professionals in the field, including those for website analytics. Applying metrics such as Users, Pageviews, and Sessions to your datasets is easy. These metrics are based on industry-standard tools like Google Analytics and Google Search Console, so you can save time and energy by avoiding the need to construct them from scratch.
Another key feature of Kyligence Zen is its Metrics Catalog, which helps align your metrics for smarter decision-making. You can define and compute your website metrics and key performance indicators (KPIs) in one place, then share and reuse them across different applications and business intelligence tools.
Kyligence Zen also provides Goals that help the marketing team streamline the business decision-making process with unified metrics across all businesses, data consumers, and decision-makers. Goals enable your marketing team to break down your marketing business objectives into relevant metrics and targets, thus aiding decision-making.
Active Customers
Retail
The total number of unique customers who made at least one purchase during a specified time period.
Average Basket Size
Retail
The average number of products sold per transaction order during a specified time period.
Average Session Duration
Website
The average duration (in seconds) of users' sessions.
Average Time On Page
Website
The average time users spent viewing this page or a set of pages.
Average Transaction Revenue
Retail
The average profit earned per transaction order during a specified time period.
Average Transaction Value
Retail
The average sales amount per transaction order during a specified time period.
Bounce Rate
Website
The percentage of sessions that were not engaged ((Sessions Minus Engaged sessions) divided by Sessions). This metric is returned as a fraction; for example, 0.2761 means 27.61% of sessions were bounces.
Chatbot Conversation Count
Marketing
The number of conversation between the customers and the chatbot on the website
Cost Per Leads
Marketing
The average cost of each Marketing Qualified Leads
/
Ⓒ 2023 Kyligence, Inc. All rights reserved.