Ⓒ 2023 Kyligence, Inc. All rights reserved.
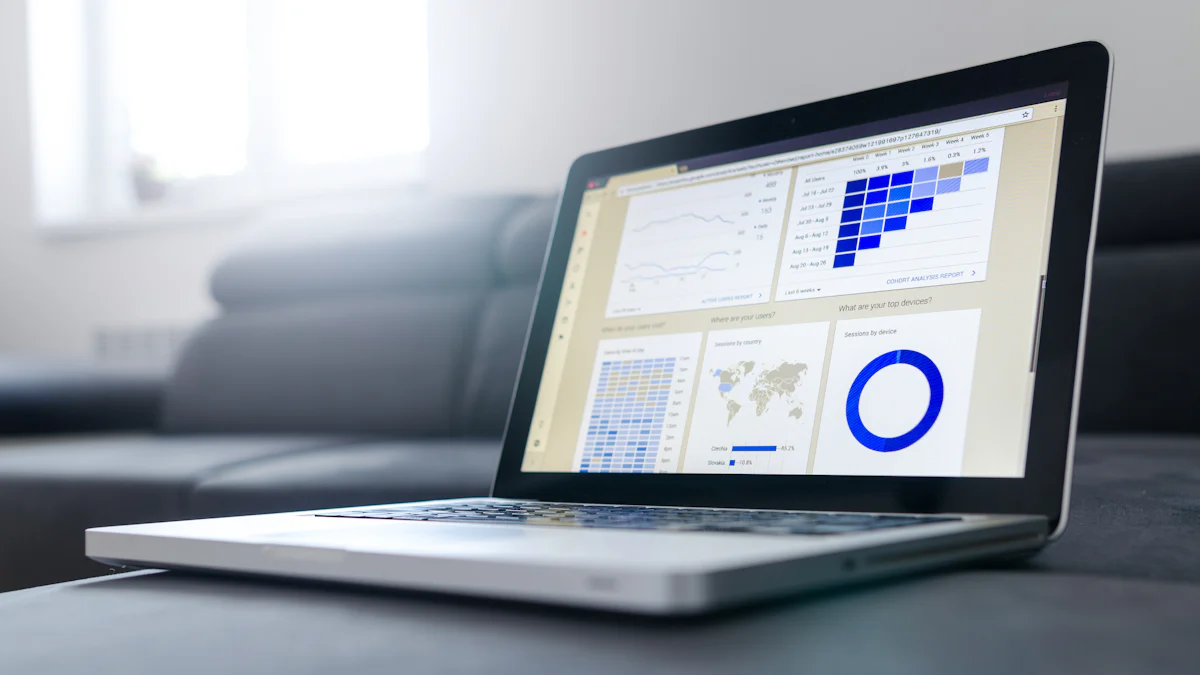
Image Source: unsplash
In today's data-driven world, the use of the right business intelligence software has become essential for most corporations. With the exponential growth of data, organizations need effective tools to extract, analyze, and transform this data into meaningful insights. Business intelligence software plays a crucial role in this process.
Business intelligence software enables organizations to gather data from various sources and convert it into actionable information. It provides a comprehensive view of the organization's operations, allowing decision-makers to make informed choices based on real-time data analysis. By leveraging business intelligence software, companies can uncover hidden patterns, identify trends, and gain valuable insights that drive strategic decision-making.
The market offers various business intelligence software options, each with its own unique features and capabilities. Two popular choices are Splunk and Tableau. These platforms offer powerful tools for extracting insights from data and have gained significant traction in the industry.
In the following sections, we will explore the strengths and use cases of Splunk and Tableau to help you determine which business intelligence software reigns supreme for your organization.
Splunk is a powerful business intelligence software that excels in monitoring and log analysis. Its comprehensive monitoring capabilities allow organizations to gain valuable insights into their systems and identify potential issues or security threats.
Splunk goes beyond traditional monitoring by capturing and analyzing all machine activities, including logins and actions taken on those machines under each user. This level of comprehensive monitoring provides organizations with a holistic view of their systems, enabling them to detect anomalies, track user behavior, and ensure system integrity. By monitoring all machine activities, Splunk helps organizations proactively identify any potential security breaches or vulnerabilities.
One of the key strengths of Splunk lies in its ability to analyze logs effectively. It provides developers and stakeholders with easy access to log events, helping reduce Mean Time to Resolution (MTTR). By analyzing log data, organizations can uncover patterns, troubleshoot issues more efficiently, and make data-driven decisions to improve their systems. Splunk's log analysis capabilities enable businesses to identify bottlenecks, optimize performance, and enhance overall operational efficiency.
Splunk's powerful log analysis tools allow users to search through vast amounts of log data quickly. With its intuitive interface and robust search functionality, users can easily filter through logs based on specific criteria or perform complex queries. This capability enables organizations to pinpoint the root cause of issues promptly and take appropriate actions.
In summary, Splunk's comprehensive monitoring capabilities combined with its powerful log analysis tools make it an ideal choice for organizations that require real-time insights into their systems. By leveraging these features, businesses can proactively monitor their infrastructure, detect anomalies early on, and make informed decisions based on accurate data analysis.
Tableau is a leading business intelligence software that empowers organizations to unleash the power of data visualization. With its real-time data visualization capabilities and user-friendly interface, Tableau enables users to gain insights and make informed decisions quickly.
One of Tableau's key strengths lies in its ability to provide real-time data visualization. It allows users to visualize patterns and trends within massive amounts of data on a real-time basis. This capability is particularly valuable for organizations that need up-to-the-minute insights into their operations. By visualizing data in real-time, businesses can identify emerging trends, monitor performance metrics, and respond promptly to changing market conditions.
Tableau's real-time data visualization goes beyond simple charts and graphs. It offers a wide range of interactive visualizations that allow users to explore complex datasets effortlessly. With just a few clicks, users can drill down into specific dimensions or filter data based on different criteria. This flexibility enables organizations to uncover hidden patterns, correlations, and outliers within their data. By visually representing data in a meaningful way, Tableau helps stakeholders understand complex information more easily and derive actionable insights.
Tableau's intuitive interface and powerful data visualization tools make it easy for users to harness the power of their data. Its drag-and-drop functionality allows even non-technical users to create compelling visualizations without the need for extensive coding or programming skills. With its user-friendly approach, Tableau democratizes access to data analysis and empowers individuals across an organization to explore and analyze data independently.
By harnessing the power of Tableau's data visualization capabilities, organizations can unlock valuable insights from their datasets. They can identify trends, outliers, and correlations that may have otherwise gone unnoticed. These insights enable businesses to make data-driven decisions, optimize processes, and drive innovation. Whether it's analyzing sales performance, tracking customer behavior, or monitoring operational metrics, Tableau provides the tools needed to transform raw data into actionable insights.
When comparing Splunk and Tableau, it is important to understand their respective strengths and use cases. While both are powerful business intelligence software options, they excel in different areas.
Splunk's strength lies in its comprehensive monitoring capabilities, making it an ideal choice for organizations that require real-time insights into their systems. With its ability to monitor all machine activities, including logins and actions taken on those machines under each user, Splunk provides a holistic view of an organization's operations. This makes it particularly valuable for use cases such as IT operations monitoring, security analytics, and compliance monitoring. By leveraging Splunk's monitoring capabilities, organizations can proactively detect anomalies, track user behavior, and ensure system integrity.
Tableau's strength lies in its powerful data visualization capabilities. It enables organizations to analyze and present data in a visually appealing manner, making complex information more accessible and understandable. With its intuitive interface and robust visualization tools, Tableau empowers users to explore data effortlessly. This makes it an ideal choice for use cases such as data analysis, business reporting, and data-driven decision-making. By leveraging Tableau's visualization capabilities, organizations can uncover hidden patterns, trends, and correlations within their data that lead to actionable insights.
While Splunk focuses on real-time monitoring and log analysis, Tableau excels in transforming raw data into compelling visualizations that drive understanding and decision-making. Depending on the specific needs of an organization - whether it requires real-time insights or impactful visualizations - the choice between Splunk or Tableau will vary.
When it comes to choosing between Splunk and Tableau, there are several factors to consider in order to select the right business intelligence software for your organization. By carefully evaluating these factors, you can make an informed decision that aligns with your specific needs and requirements.
First and foremost, consider the specific needs of your organization. Determine whether real-time monitoring or data visualization is a priority. If your organization requires comprehensive monitoring capabilities and real-time insights into systems, Splunk may be the preferred choice. On the other hand, if data visualization and analysis are critical for your organization's decision-making processes, Tableau's powerful visualization tools may be more suitable.
Scalability is another important factor to consider. Evaluate how well each software can handle increasing amounts of data as your organization grows. Both Splunk and Tableau offer scalability options, but it is essential to assess their capabilities based on your projected data growth.
Ease of use is also crucial in selecting the right business intelligence software. Consider the technical expertise within your organization and determine which software aligns better with the skill set of your team members. While both Splunk and Tableau have user-friendly interfaces, it is important to evaluate which one provides a more intuitive experience for your users.
Integration capabilities should also be taken into account. Assess how well each software integrates with existing systems and tools within your organization's technology stack. Seamless integration can streamline workflows and enhance overall efficiency.
In addition to considering the above factors, it is important to assess the cost-effectiveness and return on investment (ROI) of each software option. Evaluate not only the initial costs but also ongoing maintenance expenses. Consider whether the benefits provided by each software justify its cost in terms of improved operational efficiency, productivity gains, and better decision-making capabilities.
Furthermore, consider the expertise and resources available within your organization to implement and maintain the chosen software. Evaluate whether you have the necessary skills and resources to effectively deploy and manage either Splunk or Tableau. If additional training or hiring is required, factor in these considerations when making your decision.
By carefully evaluating factors such as real-time monitoring needs, data visualization requirements, scalability, ease of use, integration capabilities, cost-effectiveness, and available resources, you can make an informed decision that will empower your organization in the data-driven world.
Both Splunk and Tableau offer unique strengths and capabilities in the realm of business intelligence software. However, the choice between these two platforms ultimately depends on the specific needs and requirements of your organization.
Splunk excels in comprehensive monitoring capabilities, making it ideal for organizations that require real-time insights into their systems. It is particularly valuable for use cases such as IT operations monitoring, security analytics, and compliance monitoring. On the other hand, Tableau's strength lies in its powerful data visualization capabilities, enabling organizations to analyze and present data in a visually appealing manner. It is well-suited for use cases such as data analysis, business reporting, and data-driven decision-making.
When making a decision between Splunk and Tableau, it is important to carefully evaluate factors such as monitoring capabilities, data visualization tools, scalability, and cost-effectiveness. Consider the specific needs of your organization and assess which software aligns best with those needs. Additionally, consider factors like ease of use, integration capabilities, cost-effectiveness, and available resources within your organization.
While both Splunk and Tableau are popular choices in the business intelligence software market, it is worth exploring other options that may better suit your organization's needs. Implementing these tools can provide valuable insights into your operations and empower you to make informed decisions based on accurate data analysis.
In conclusion, by thoroughly evaluating the strengths and use cases of Splunk and Tableau while considering factors such as monitoring capabilities, data visualization tools, scalability, cost-effectiveness, and available resources within your organization, you can make an informed decision that will empower your organization in today's data-driven world.