

Ⓒ 2023 Kyligence, Inc. All rights reserved.

In today's digital age, having a website is essential for any business to succeed. However, simply having a website is not enough. You need to know how your website is performing and what your visitors are doing on it to make informed decisions and improve your online presence. This is where Google Analytics comes in - a powerful tool that provides valuable insights into website traffic and user behavior. By understanding the data provided by Google Analytics, you can optimize your website for better performance, increase conversions, and ultimately grow your business. In this blog post, we will dive deeper into the world of Google Analytics and focus specifically on dimensions vs metrics - two fundamental concepts that are crucial for understanding how to use Google Analytics effectively.
When it comes to analyzing website performance in Google Analytics, two terms that often come up are dimensions and metrics. While they may seem similar, they serve different purposes in data analysis.
Dimensions in Google Analytics are attributes of website visitors or their behavior on a website. They provide context for the data being analyzed. Examples of dimensions include location, device type, traffic source, and page title.
Metrics, on the other hand, are quantitative measurements of user behavior on a website. They answer specific questions about user activity and can be used to track progress towards goals. Examples of metrics include sessions, bounce rate, pages per session, conversion rate, and revenue.
In simpler terms, dimensions describe what happened on a website while metrics measure how many times it happened.
Understanding the difference between dimensions and metrics is crucial for customizing reports and gaining deeper insights into website performance. By using both dimensions and metrics together in analysis, businesses can uncover patterns and trends that may not be visible with just one or the other.
For example, using the dimension of location along with the metric of conversion rate can help businesses identify which geographic areas have higher conversion rates. This information can then be used to tailor marketing efforts towards those areas for better results.
In addition to providing insights into website performance, understanding dimensions and metrics also helps with goal setting. By identifying which metrics are most important for measuring progress towards business objectives (such as increasing sales or improving user engagement), businesses can focus their efforts on improving those specific areas.
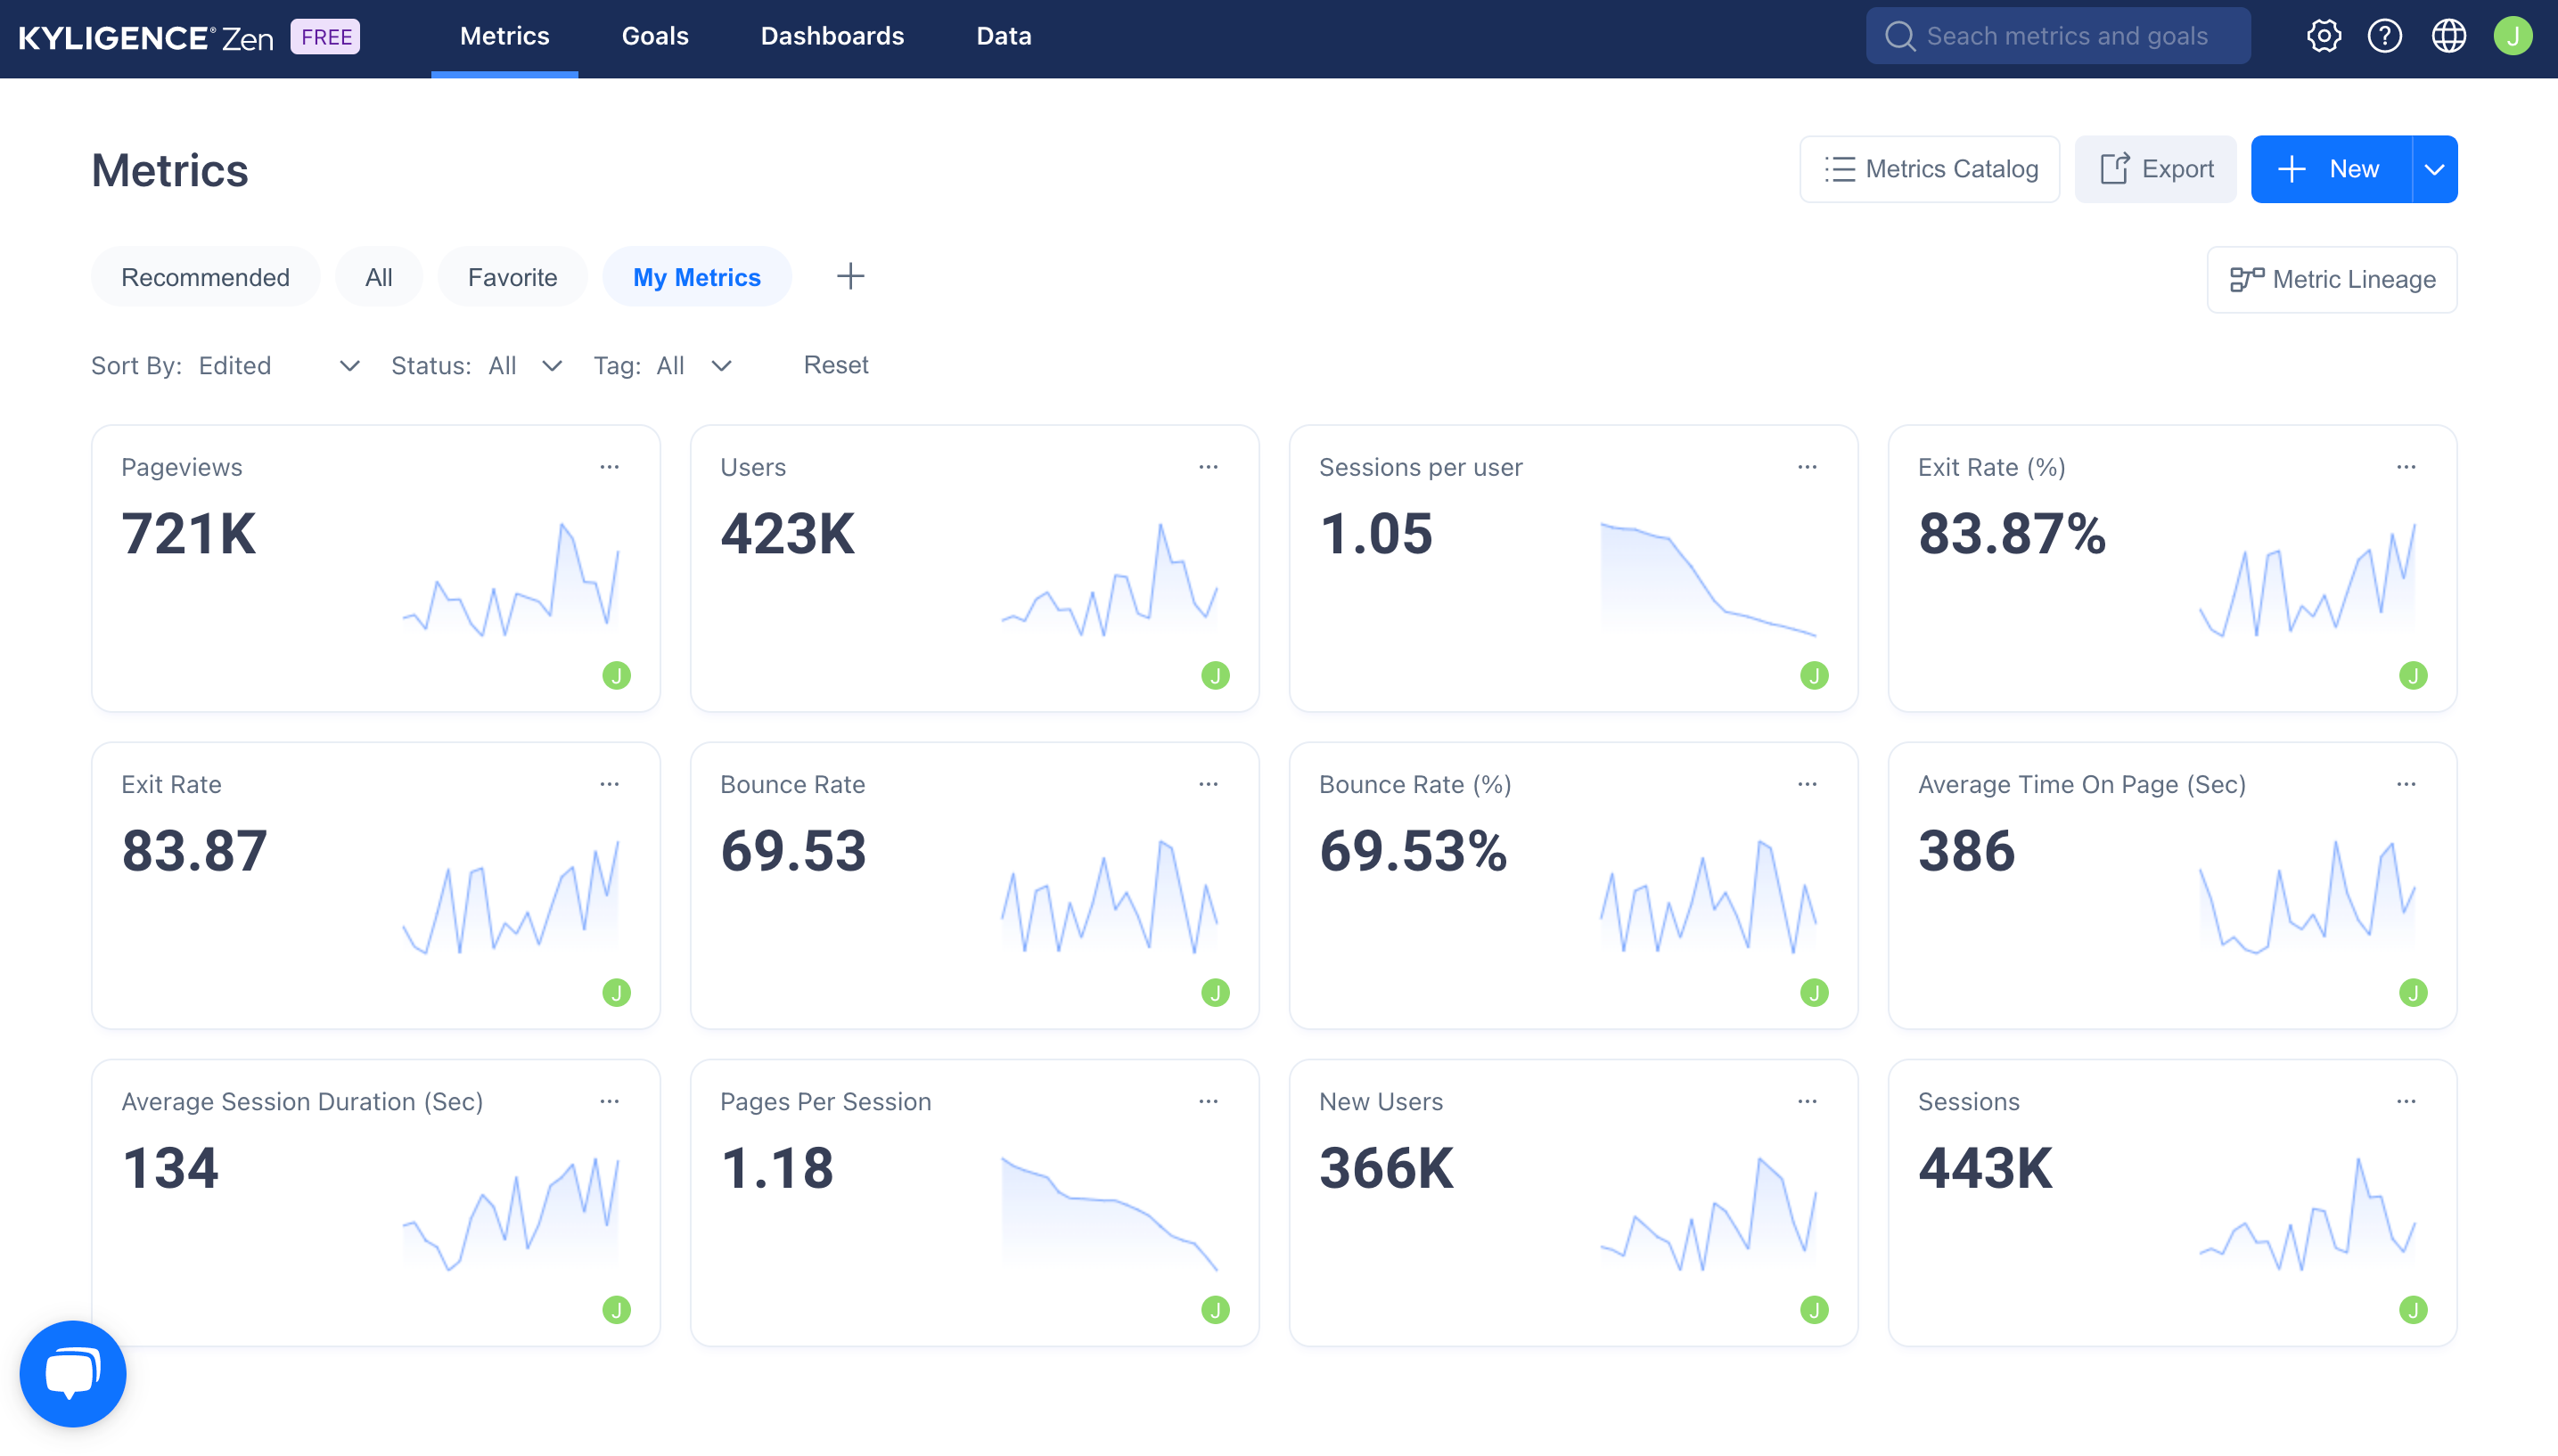
Google Analytics provides a wealth of information about website traffic, user behavior, and more. However, to make sense of this data, it's important to understand the difference between dimensions and metrics. Metrics are quantitative measurements that provide insight into specific aspects of website performance. Common metrics in Google Analytics include sessions, bounce rate, pageviews, and time on page.
Users: The number of distinct users who visited your site or app.
New Users: The number of users who interacted with your site or launched your app for the first time (event triggered: first_open or first_visit).
Sessions: The number of sessions that began on your site or app (event triggered: session_start).
Pageviews: The number of app screens or web pages your users viewed. Repeated views of a single page or screen are counted. (screen_view + page_view events).
Pages Per Session: The number of app screens or web pages your users viewed per session. Repeated views of a single page or screen are counted. (screen_view + page_view events) / sessions.
Average Session Duration: The average duration (in seconds) of users' sessions.
Average Time On Page: The average time users spent viewing this page or a set of pages.
Bounce Rate: The percentage of sessions that were not engaged ((Sessions Minus Engaged sessions) divided by Sessions). This metric is returned as a fraction; for example, 0.2761 means 27.61% of sessions were bounces.
Exit Rate: The percentage of exits from the property that occurred out of the total pageviews.
Sessions per user: The average number of sessions per user.
Dimensions are attributes that provide context for metrics by categorizing them according to specific criteria. Common dimensions in Google Analytics include source/medium, device category, location, and page.
Source/medium refers to where traffic is coming from (e.g., search engine or social media platform) and what type of traffic it is (e.g., organic or paid).
Device category identifies whether users are accessing your site from desktops/laptops or mobile devices.
Location indicates where users are located geographically. Finally, page tells you which pages on your site are being viewed.
By combining metrics and dimensions in various ways, you can create custom reports that provide deeper insights into user behavior and website performance. For example, you could create a report that shows how many sessions were generated by users from different geographic locations or which pages have the highest bounce rates for mobile users.
To analyze Google Analytics data more efficiently and effectively, consider using Kyligence Zen. This powerful analytics tool allows you to easily query large amounts of data across multiple dimensions and metrics with easy-to-use interface. With Kyligence Zen, you can quickly identify trends and patterns in your data that may not be immediately apparent through manual analysis.
Google Analytics is a powerful tool for tracking website and app usage, with two different analysis methods: Universal Analytics and Google Analytics 4. Universal Analytics is the original tracking method, which has been in use since 2005. It provides detailed information about user behavior on your website or app and allows you to track user interactions and conversions across multiple devices. In contrast, GA4 is a newer method, which was introduced in 2020.
Google Analytics 4 is replacing Universal Analytics. On July 1, 2023, your Universal Analytics properties will stop collecting data. Only GA4 properties will collect data after July 1. To help you with this transition, beginning in March 2023.
So, it is important for user who track website metrics & KPIs to understand the difference between these top metrics in Universal Analysis and Google Analytics.
Users
UA: Total number of users
GA4: Number of distinct users who visited your website or application. An active user is any user who has an engaged session or when Analytics collects:
the first_visit event or engagement_time_msec parameter from a website
the first_open event or engagement_time_msec parameter from an Android app
the first_open or user_engagement event from an iOS app
New Users
UA: Number of users who interacted with your site for the first time
GA4: Number of users who interacted with your site or launched your app for the first time. The metric is measured by the number of new unique user IDs that logged the first_open or first_visit event.
Sessions
UA:
Period of time a user is actively engaged with your website or app
Has defined parameters for what may cause it to end e.g. a session will end when there has been more than a 30-minute period of inactivity (depending on the session timeout settings), the timestamp has been cut off at midnight (according to the timezone the view is set up in), or new campaign parameters are encountered.
If a user comes back after a session timeout, it will start a new session
If the user is on the website when midnight arrives, a new session will be started
If a user picks up new campaign parameters while on the website, a new session will be started
GA4:
To determine the session that each event comes from, the session_start event generates a session ID and Analytics associates the session ID with each subsequent event in the session
A session will end when there has been more than a 30-minute period of inactivity (depending on the session timeout settings)
Sessions are not restarted at midnight or when new campaign parameters are encountered
If a user comes back after a session timeout, it will start a new session
Pageviews
UA: Total number of pages viewed. Repeated views of a single page are counted.
GA4: aka Views: Total number of app screens and/or web pages your users saw. (The Views metric found in the reporting interface is the combination of pageviews and screenviews.) Repeated views of a single screen or page are counted.
Pages Per Session
UA: The average number of pages viewed during a session, including repeated views of a single page. This field is disallowed in segments.
GA4: aka views per session. The number of app screens or web pages your users viewed per session. Repeated views of a single page or screen are counted. (screen_view + page_view events) / sessions.
Average Session Duration
UA: The average duration (in seconds) of users' sessions.
GA4: The average duration (in seconds) of users' sessions.
Average Time On Page
UA: The average time users spent viewing this page or a set of pages.
GA4: The average amount of time users spent on the page.
Bounce Rate
UA: Percentage of single page sessions in which there was no interaction with the page. A bounced session has a duration of 0 seconds. For example, if a user visits your website and reviews content on your homepage for several minutes, but leaves without clicking on any links or triggering any events being recorded as interaction events, then the session will count as a bounce.
GA4:
Percentage of sessions that were not engaged sessions. For example, if a user visits your website, reviews content on your homepage for less than 10 seconds, and then leaves without triggering any events or visiting any other pages or screens, then the session will count as a bounce.
An engaged session is a session that lasts 10 seconds or longer, has 1 or more conversion events, or has 2 or more page or screen views. If a user doesn't have an engaged session (that is, they don't meet any of the criteria for an engaged session), then Google Analytics counts the session as a bounce.
Exit Rate
UA: The percentage of exits from the property that occurred out of the total pageviews.
GA4: The percentage of sessions that ended on a page or screen. The rate is equal to the number of exits divided by the number of sessions.
Sessions per user
UA: The total number of sessions divided by the total number of users.
GA4: The average number of sessions per user (Sessions divided by Active Users).
Kyligence Zen is a powerful data analytics platform that can be used to analyze Google Analytics metrics and dimensions. It is an enterprise-level solution that provides businesses with the ability to process large amounts of data quickly and efficiently. With Kyligence Zen, businesses can gain deeper insights into their website traffic and user behavior, which can help them make better decisions.
Kyligence Zen is the go-to low-code metrics platform to define, collect, and analyze your business metrics. It empowers users to quickly connect their data sources, define their business metrics, uncover hidden insights in minutes, and share them across their organization. It is designed to work with a variety of data sources, including Google Analytics.
Kyligence Zen is built on Apache Kylin, an open-source distributed analytical engine. This means that it has been tested and proven by some of the largest companies in the world, including eBay, and Yahoo! Japan.
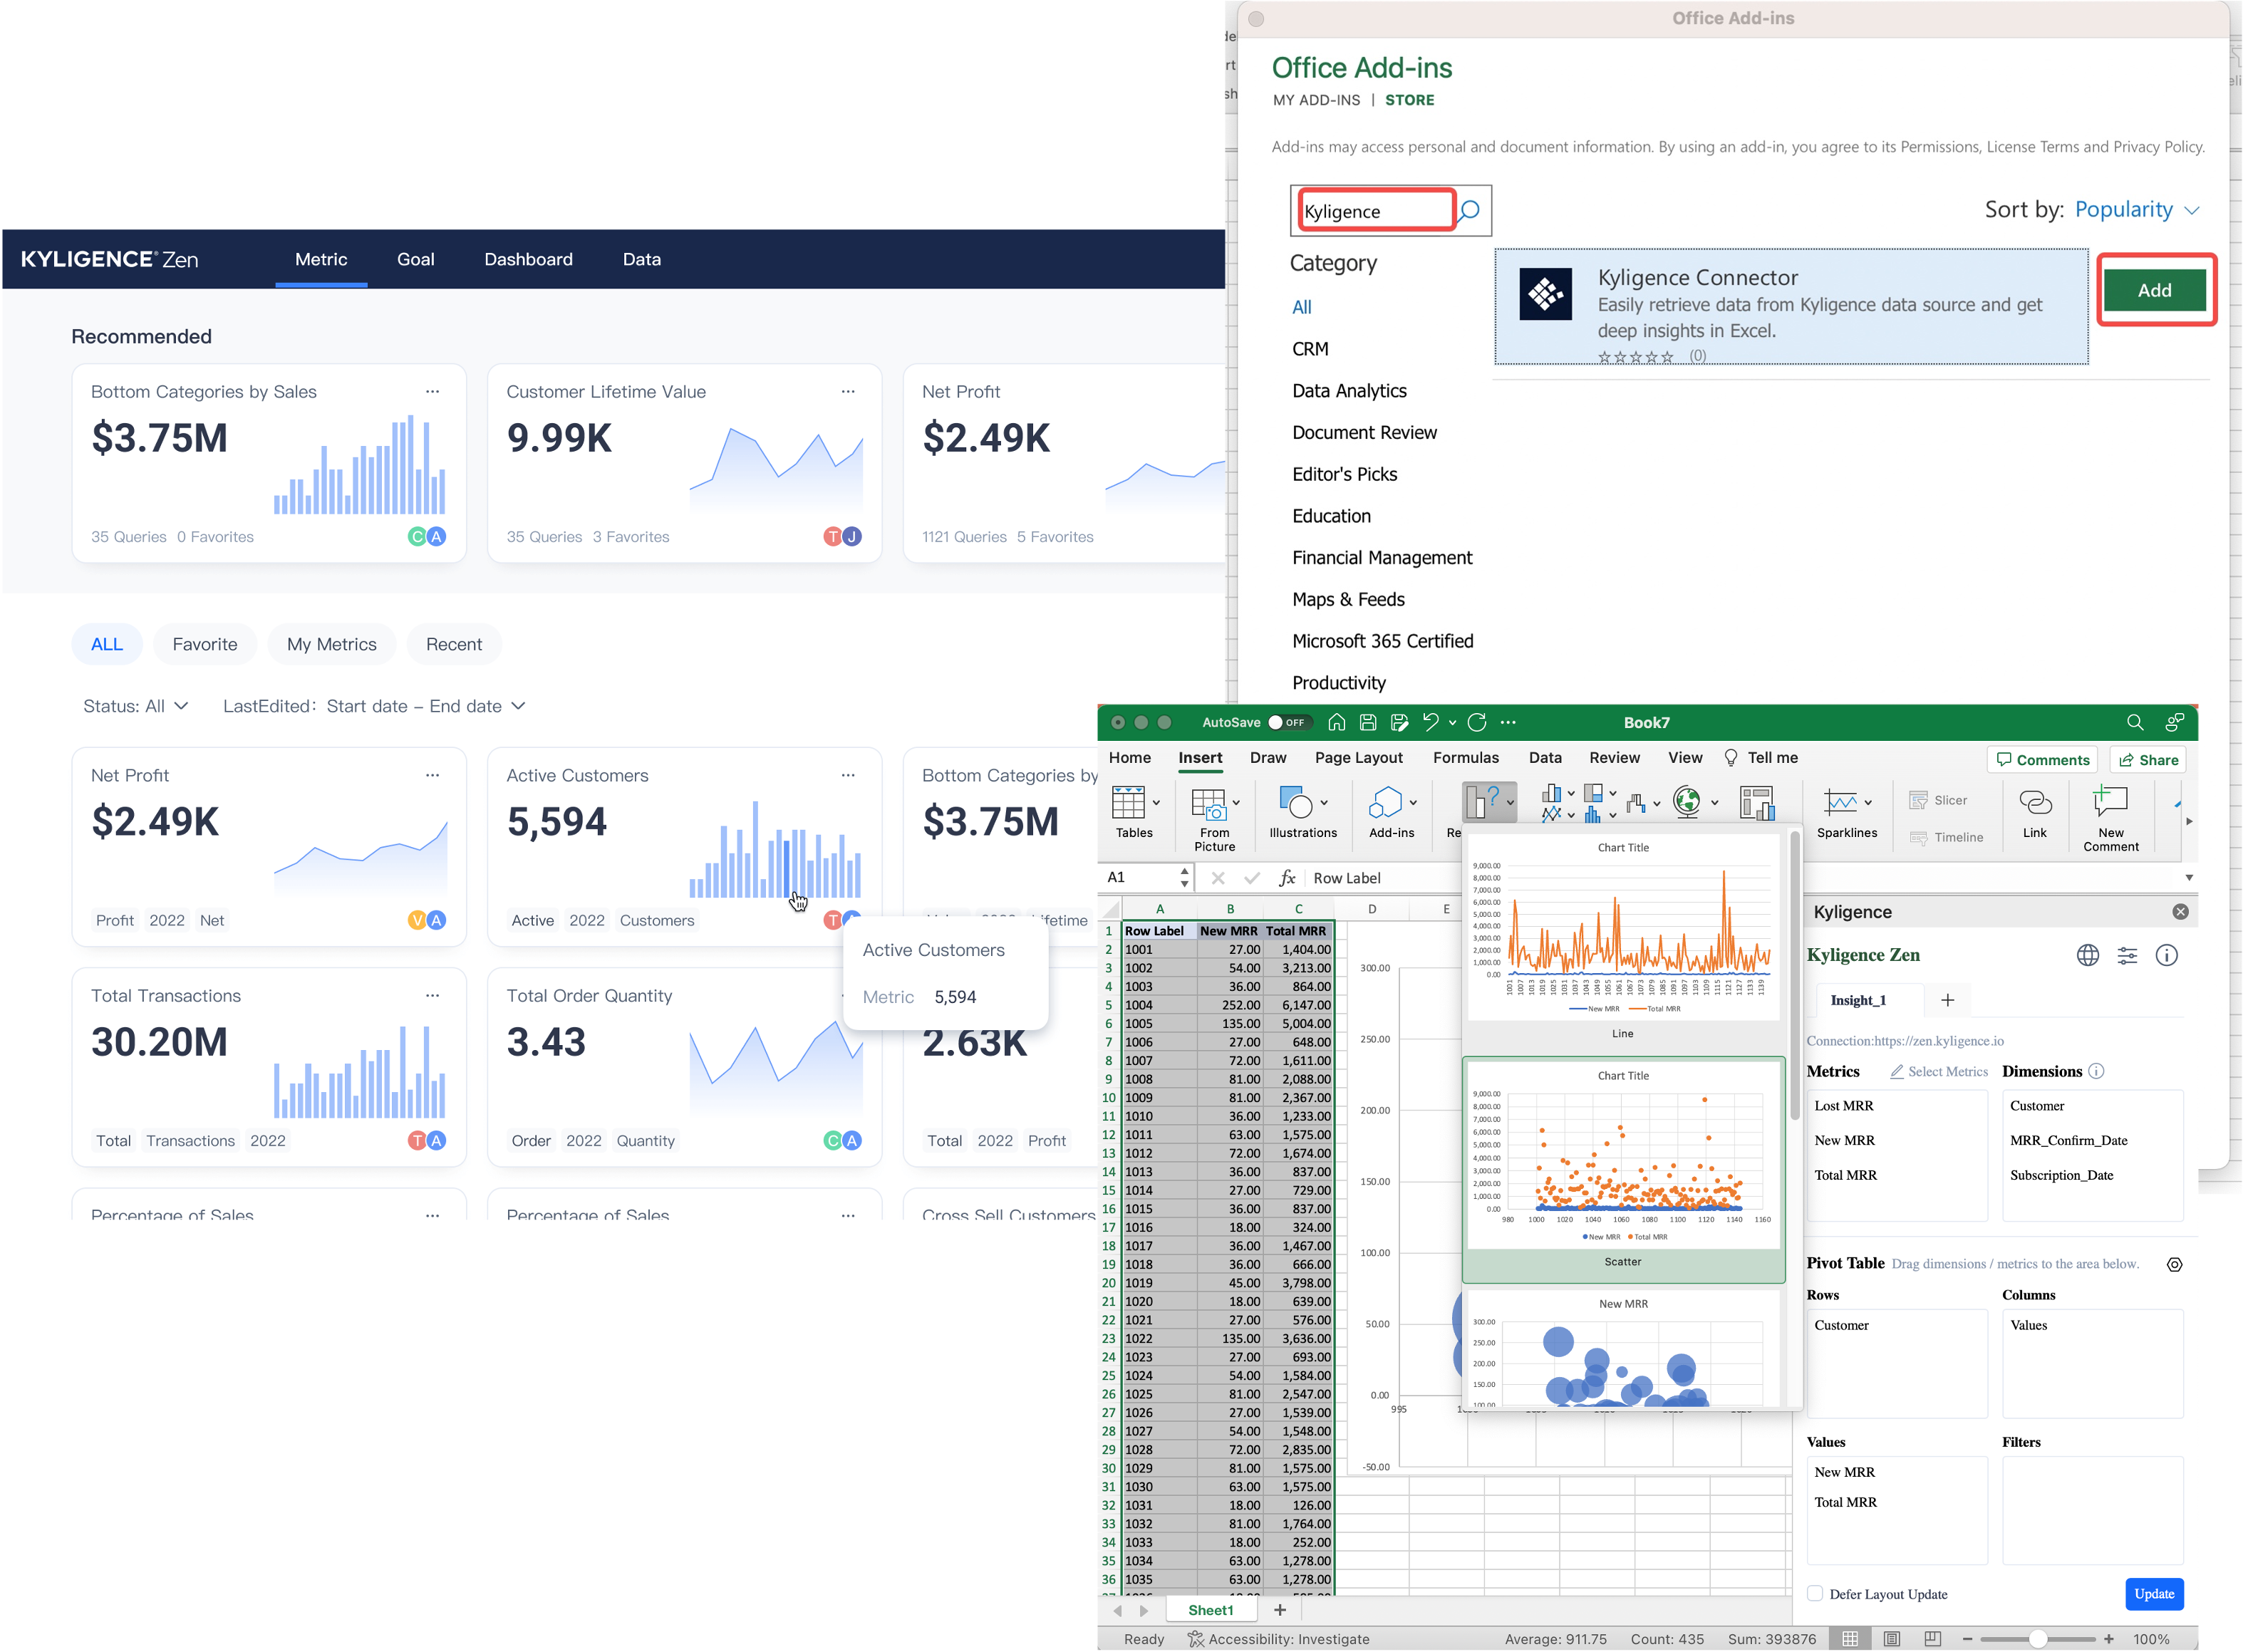
Using Kyligence Zen for Google Analytics analysis is easy. The first step is to download your Google Analytics data into CSV file or load into AWS S3. This can be done using third-party tool such as Amazon AppFlow or Quicktable.io.
Once you have connected Kyligence Zen to your Google Analytics account, you can start creating metrics using drag-and-drop interface. Or alternatively, you can leverage the metrics template we built especially for Google Analytics.
Top Google Analytics Metrics & KPIs that need to be tracked: Users, New Users, Sessions, Pageviews, Pages Per Session, Average Session, Duration, Average Time On Page, Bounce Rate, Exit Rate, Sessions Per Users. Kyligence Zen makes it easy to connect your organization’s data and metrics with the BI and SaaS tools that make sense for your business—no matter what they are. Align all of your businesses, data consumers, and decision-makers on one unified metrics platform
One of the key benefits of using Kyligence Zen for Google Analytics analysis is its ability to choose the analytic option that suits your needs. Your team can choose to build customizable dashboards tailored to your metrics, or seamlessly connect your metrics to Excel for an intuitive, drag-and-drop Pivot-table experience.
Kyligence Zen also good at process large amounts of data quickly. With Kyligence Zen's Smart Cache, you can run complex queries without having to wait for hours or days for results.
Kyligence Zen also provides Goals that help the marketing team streamline the business decision-making process with unified metrics across all businesses, data consumers, and decision-makers. Goals enable your marketing team to break down your marketing business objectives into relevant metrics and targets, thus aiding decision-making.
In conclusion, understanding the difference between dimensions and metrics in Google Analytics is crucial for any business owner, marketer or website analyst who wants to gain valuable insights into their website performance. By knowing how to use these tools effectively, you can customize your reports and get a deeper understanding of your audience's behavior. Additionally, using Kyligence Zen can help you analyze your data more efficiently and accurately. With this tool, you can define, collect, and analyze your google analytics metrics. It empowers users to quickly connect their data sources, define their business metrics, uncover hidden insights in minutes, and share them across their organization.
Overall, Google Analytics is an essential tool for any business looking to improve its online presence. By taking the time to understand dimensions and metrics, you can unlock the full potential of this powerful platform and gain a competitive edge in today's digital landscape. Remember to keep track of your progress regularly and adjust your strategies accordingly based on the insights gained from Google Analytics. With dedication and perseverance, success is within reach!